Over the past four decades, the economic miracle of China has been striking since Deng Xiaoping, the late paramount leader, visited the U.S. at the end of January 1979. At that time, China’s total imports and exports accounted for less than one percent of the world trade, $20.6 billion. In 2016, China’s import and export volume reached $3.7 trillion, 143 times the level of 1978. Last year, China’s total trade surplus was $510 billion, in which 60 percent originated from the U.S. The IMF and the World Bank regarded China as the world’s largest economy based on Purchasing Power Parity. Moreover, the Centre for Economics and Business Research predicts China’s economy will surpass the US’s in 2029.
China’s “Miracle Growth” has raised concerns from the West as they evaluate how China’s development will affect the world economic regime. But the U.S. has benefited from trade with China. As China has become the player of the global production supply chain, much of its output is composed of made in U.S. components. China has to import lots of capital goods and industrial materials from the U.S. to assemble high-tech products. Actually, China has become the third-largest purchaser of U.S. outputs, and the PRC imported $169.81 billion of goods and services from the U.S. in 2016.
“China’s growth is fortifying U.S. commercial power, because Chinese companies are participating in global production networks, which means obedience to foreign economic rules. Simultaneously, Chinese companies assemble products for export to the West, the most valuable components for those products come from the West. Thus, U.S. share of global manufacturing, by value, has actually increased since 1990.” (Steinfeld, 2010)
Chinese companies also receive benefits from the global production network. For example, the availability of chip design tools, chip manufacturing services, and open-source software allows Chinese firms to develop their own products including smartphone.
Under Chairman Mao, planned economy ruled the state. China was poor. When Deng Xiaoping addressed policy reform and opened-up at the end of 1978, China widened its trade relationship with the West including the U.S. The third Plenary of the 11th Central Committee of the CCP in late 1978 was regarded as the shifting moment of the economy. It permitted local farmers to sell their production in markets. Next year, the PRC allowed foreign capital to enter its market by enacting the Law on Chinese Foreign Equity Joint Venture. China attracted foreign companies to its special economic zones, and took steps to boost exports. Beijing Zhongguancun Science Park and Shanghai Zhangjiang Hi-Tech Park became high-tech manufacturing zones.
In 1990, the Shanghai stock exchange opened as a result of reform and opening policy. In 1992, Deng said Guangdong would catch up with Asia’s Four Dragons in 20 years when he went on tour of Southern China. Under Deng, China was open and learned from the West. China had been ready to catch up with the world.
In November 2001, China became the 143rd member of the WTO. Accession of WTO enabled China to enter the global network, and became a catalyst as a trading super power. Trade has become its engine of economic growth. China’s total trade to GDP ratio has exceeded 50 percent since 2002. China’s imports and exports grew rapidly, in which total trade value marked $1 trillion in 2008. In 2016, China’s total import and export volume reached $3.6849 trillion; export $2.09744, import $ 1.58748. Recently, China GDP grows by 6.9% in the first quarter 2017, its fastest pace since 2015.
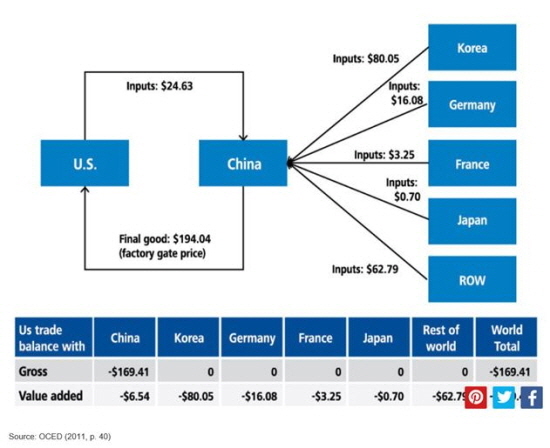
The U.S. has complained about the trade deficit with China. President Donald Trump attacked China during his presidential campaign last year emphasizing the negative impact of China on the U.S. economy including jobs lost by American workers. In 2016, U.S. exports of goods and services to China reached $169.8 billion, whereas imports from the PRC were $479.6 billion. As a result, the U.S. trade deficit with China marked $309.8 billion.
However, U.S. trade deficit with China was exaggerated by the global supply-chain. Technologies have allowed MNCs to geographically diffuse their production bases. Unbundling and the global production networks have made trade more complicated.
Global production network has transformed trade patterns. Developing countries like China export high-tech gadgets whereas industrialized countries import them from developing countries.
Actually, according to the U.S. Census Bureau, 40.8 percent of U.S. annual imports of electrical machinery and 32.4 percent of imports of mechanical appliance were from the PRC in 2016.
Conventional trade statistics inflate trade deficit between PRC and the U.S. Chinese assembling companies import both the knowledge-intensive components used in export processing and capital equipment for manufacturing from the U.S. Core components including integrated circuits and sensors are highly capital intensive. The Chinese Customs classifies them as exports, when high-tech products, assembled in mainland China, are shipped abroad. Thus, high-tech goods contribute to the U.S. trade deficit.
“Current trade statistics are misleading and greatly inflated China’s exports in high-tech products and created a myth. If the value added approach was employed to record trade flow, the value of the high-tech exports would shrink significantly.” (Yuqing Xing, 2012)
With its low-cost labor force, China is becoming a popular place in global supply chain, but is at the low-end of the value chain including assembling. For example, the largest electronics supply chain in the world has taken shape in Shenzhen.
While the U.S., with its software power, is at the high-end of global production network. Sales of Qualcomm in China including chip and patent royalty account for 57 percents of its total sales. Apple iPhones are developed in the U.S., but more than 80% of them are assembled in mainland China by Taiwan manufacturer.
In addition, Chinese company, which has a semiconductor fabrication plant in the PRC, should import expensive manufacturing equipment from the Applied Material or Lam Research. Moreover, after purchasing, the company gives the additional pays to the U.S. supplier in response to maintenance and upgrading of the equipment.
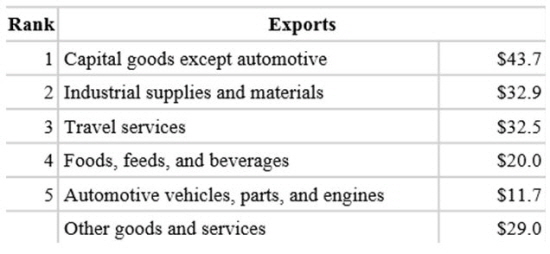
In spite of massive trade deficit with China, the U.S. receives benefits from China. The PRC is the third largest purchaser of U.S. goods and services after Canada and Mexico. According to U.S. Census Bureau of Economic Analysis, exports to China accounted for 7.7 percent of all U.S. exports in 2016. Exports were led by capital goods excluding automotive, which account for 25.7% of total export to the PRC, $43.7 billion. China also is the largest export market of U.S. soybean. According to Chinese Customs, the U.S. exported 33.66 million tons of soybeans, $13.8 billion, to China.
Exports to China also have brought benefits to the states of America. According to U.S.-China Business Council (USCBC) U.S. Export to China by State, China has been among the top three export destination for 33 states in 2015. 30 states exported more than $1 billion to China in 2015, and 31 states had undergone triple-digit growth.
Auto companies also have benefited from trade with China. According to China Association of Automobile Manufacturers, GM, Ford, and Fiat-Chrysler sold 5.1 million automotives in 2016. 4.01 millions automotive were from GM, 944,000 were from Ford, and 146,000 were from Fiat-Chrysler. They are China’s joint venture auto enterprises. MOFCOM estimated that the profits of the three companies reached $7.44 billion in 2015.
The U.S. has been gaining trade surplus from China in service segments. According to BEA, the U.S. surplus in services represented 55.7 billion, 40 times the amount of 2006. For example, the Chinese Ministry of Commerce estimated that Chinese tourists spent $13,000 in the U.S. per person in 2016. According to BEA, U.S. exported travel services to China at $35.22 billion in 2016. The U.S. also exports massive of education services to China. U.S. Immigration and Customs Enforcement stated that 353,300 Chinese students studying in the U.S., accounting for 34% of the number of foreign student in the States. According to the Chinese Ministry of Commerce, Chinese student spent about $45,000 per person in 2016. Movie is one of the dynamic parts in U.S.-China trade relation. According to the Chinese Ministry of Commerce, China imported 51 U.S. movies in 2016, 16$ billion of revenue for the U.S. companies.
Chinese investment in the U.S. is rapidly increasing. According to BEA, in 2015, Chinese enterprises invested 14.8$ billion in the U.S., an increase of 50.6% compare to 2014. In 2016, Chinese enterprises invested $45.6 billion in the U.S. USCBC estimates that Chinese-owned companies in the U.S. contribute to 104,000 jobs. Furthermore, the institution argued that trade with China supports roughly 2.6 million U.S. jobs, and created $216 billion in growth in 2015.
For example, Haier, Chinese home appliance manufacturer, employs 12,000 workers in Kentucky, Indiana, Alabama, Georgia, and Tennessee. Wanxing Group has contributed over 12,000 jobs in the U.S. Fuyao Group created 2,100 jobs to build an automotive glass production facility in Dayton, Ohio.
USCBC president John Frisbie said Technology has had a far bigger impact on the U.S. manufacturing employment than China, and take appropriate actions to support growth and impacted workers.
On 12 May, Department of Commerce addressed that China is to allow imports of U.S. beef no later than July 16, 2017. In addition the U.S. and China are to resolve issues for the import of Chinese cooked poultry to America as soon as possible. China is the second largest export market for U.S. agricultural products
In addition, China is to allow foreign-owned financial companies in China to provide credit rating services, and to begin the licensing process. Moreover, China is to issue any further necessary guidelines and allow U.S. owned suppliers of electronic payment services to begin the licensing process.
China will expand imports of energy including natural gas and oil from the U.S., because the U.S. decided to permit for Chinese companies to negotiate all types of contractual arrangement with U.S. LNG exporters in May 2017. According to China Customs, China imported 26.154 million tons of LNG from foreign countries, including 199,000 tons (0.76%) from the U.S. in 2016. China has plans to import manufactured goods including aircraft and integrated chips from the U.S.
Apple was established in 1977 and its headquarter located in Cupertino, California called Silicon Valley. Mike Scott, at that time President Apple, said “our business was designing, educating and marketing” in 1982. In the 1990s, the company sold off most of its in-house manufacturing base. Its success is inseparable from global supply chain based mainly in PRC.
“Apple’s 2016 annual report described its supply chain. “Substantially all of the company’s hardware products are manufactured by outsourcing partners that are located primarily in Asia. A significant concentration of this manufacturing is currently performed by a small number of outsourcing partners, which are the sole-sourced suppliers of components and manufacturers for many of the company’s products.
iPhones designed and marketed by Apple whereas assembled in mainland China plants owned by Foxconn, a Taiwan based company. Foxconn has factories throughout the country including Shenzhen, Beijing, Tianjin, Shanghai and Chongqing.
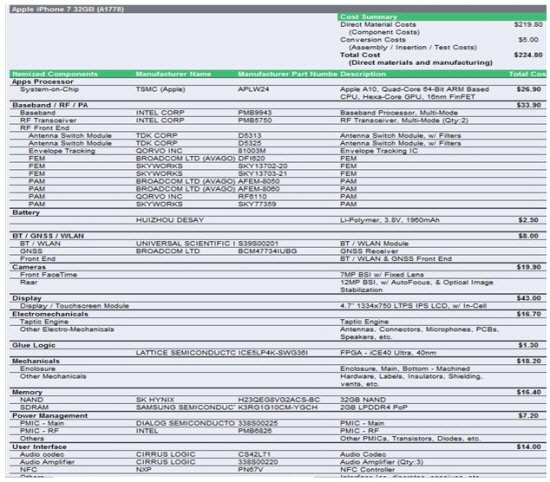
The suppliers of iPhone7 32GB(A1778), which was launched last year, involves several countries including the U.S., Germany, Japan, South Korea, China, etc. The major suppliers of iPhone7 components are Apple, Intel, Broadcom, Dialog Semiconductor, Cirrus Logic, NXP, Bosch, LG Display, Samsung Electronics. All components are moved to Foxconn’s assembly line located in mainland China. Chinese workers screw all parts together. Then, final products exported to the world including the U.S. In fact, China exports iPhones to the U.S. despite the product belongs to Apple. The manufacturing process of iPhone shows the global production network. The imported components from developed countries inflate China’s export value. iPhone contributes to the U.S. trade deficit to China.
Xing and Detert estimated the U.S.’ trade deficit with China associated with iPhone. “In 2009, iPhone contributed $1.9 billion to the trade deficit. Under the existing production patterns, in which all iPhone are exclusively assembled in the PRC, the contribution of iPhone to the Sino-U.S. trade deficit would be expected to rise further as more and more Americans purchase iPhone.”
China workers only contribute to the assembling cost, whereas most of the value from iPhone goes to American companies including Apple. For example, the component costs of iPhone7 are estimated at $219.80, whereas conversion costs (assembly-insertion-test), the form of wages paid for assembly, generated in China reach $5. The cost originated in the PRC accounts for only 2.22% of the total manufacturing cost.
The more than 60% profit margin leaves U.S. companies including Apple. Apple has a power to capture a 60 percent of the value of iPhone despite the fact that manufacturing is outsourced from contractor based on China. IHS estimates that profit margin of iPhone7 reaches 65.41%.
iPhone7’s retail price is $649.99. Apple supplies iPhone7 to Carrier like Verizon at $549.99. Costs of its components are $219.80 whereas the costs of assembly in mainland China estimates at $5. From the sales, Apple earns $309 and Verizon benefits $100.
The U.S. component firms also earn money from iPhone7. The cost of application processor manufactured by Apple reaches $26.90. Intel supply baseband and RF transceiver, which estimates $33.90 to iPhone. The cost of user interface made by Cirrus Logic and NXP is $14. Lattice Semiconductor provides Glue Logic at $1.30.
In addition, China is the third biggest market with Apple following the U.S. and Europe. Apple’s net sales in Greater China including PRC, Hong Kong and Taiwan reached $48,492 million in 2016, in which proportion of total net sales is 22 percent. Operation income accounts for $18,835 million. According to IDC, the U.S. market research institution, iPhone shipment in China was 44.9 million, 20.8% in worldwide shipment in 2016.
“While iPhone is manufactured in China, the primary benefits go to the U.S. economy as Apple continues to keep most of its product design, software development, marketing and other high-wage functions in the U.S. With its control over the supply chain, Apple has the power to make and break the fortunes of many of its suppliers.” (Kremer, Linden, Dedrick, 2011)
The relationship between Wal-Mart and Chinese suppliers in the knitwear shows global supply chain. Wal-Mart has operated a supply networks in China since early 2000. Supplier including Langsha, Boshan and the Jiaxing Yishangmai Fashion has become supplier to Wal-Mart. To attract the big buyer like Wal-Mart, supplier should import expensive capital equipment including knitting machines and cutting machines from the U.S. and other developed countries.
In case of down jacket, the U.S. importers receive the main beneficiaries. According to MOFCOM, in 2016, down jacket exports from China to the U.S. reached $310 million. The consumer prices in the U.S. market were around $500, though the export price of high-end down jacket was around $60. The profit made by Chinese company accounted for 1-2% of the terminal prices of the products, whereas the U.S. importers have taken massive profit from sales of down jacket.
The global production network has also lowered entry barriers for Chinese chip makers to enter smartphone market. Leo Li, CEO of Spreadtrum stated “The availability of IC design tool, fab services, and open-source smartphoTne software allows Chinese companies to circumvent their weak spots and develop their strengths in hardware, IC design, and integration.”
Spreadtrum is a Fabless semiconductor company that develops mobile chipset platforms for smartphones. ARM, a British software design company, supplies building blocks, using in a final processor design, to Spreadtrum. The company uses the blocks to design IC called application processor (AP).
When AP design is completed, it is moved to the manufacturing facilities operated by TSMC, Taiwan Semiconductor Manufacturing Company. The company provides manufacturing services from its foundries to its clients designing chips. Spreadtrum then packages them into individual chips and sell to phone makers including Huawei, the world’s third-largest smartphone makers after Samsung Electronics and Apple. Finally, Huawei assembles components, then designs a software interface using Google Android. Chinese high-tech firms are moving toward higher value-added production process. These firms receive aids from government. The National Semiconductor Industry Development Guidelines include highly ambitious targets to upgrade the domestic industry’s design and manufacturing capacity, packaging and testing technology. This encompasses the three stages of semiconductor manufacturing: design, fabrication and assembly, packaging and testing. For example, Tsinghua Unigroup, a majority-owned subsidiary of Tshinghua University’s government-owned Tshinghua Holdings, purchased RDA and Spreadtrum, China’s chip companies.
Since the normalization of U.S.-China official relations 45 years ago, bilateral trade has been advancing, despite U.S. has contended massive trade deficit with China. Technologies have allowed U.S. firms to geographically diffuse their production bases. Unbundling and the global production networks have made trade more complicated.
Trade between U.S. and China benefit both countries on account of global production network. U.S. companies like Apple can capture from the high value products using the Chinese labor force. U.S. companies have strong capacities including technology and management. Whereas China, with the low-cost work force, is becoming a key player in the global supply chain, but it is at the low-end value chain.
Moreover, in terms of U.S. export to China, China is the U.S. third largest export market behind Canada and Mexico, NAFTA member countries.
Xing Yuqing, Detert Neal. 2010. How the iPhone Widens the United States Trade Deficit with the People’s Republic of China. ADBI Working Paper 257. Tokyo: Asian Development Bank Institute.
Steinfeld. 2010. Playing our Game: Why China’s Economic Rise Doesn’t Treaten the West. Oxford University Press. p.p 95-100
Jenny Chan, Ngai Pun, Mark Selden. 2013. The politics of global production: Apple, Foxconn and China’s new working class. New Technology Work and Employment 28:2. John WileySons
Kenneth L. Kremer, Greg Linden, Jason Dedrick. 2011. Capturing Value in Global Networks: Apple’s iPad and iPhone.
Xing Yuqing. 2011. China’s High-tech Export: Myth and Reality. GRIPS Discussion Paper 11-05. National Graduate Institute for Policy Studies
Jason Dedrick, Kenneth L. Kraemer, Greg Linden. 2008. Who Profits from Innovation in Global Value Chains? A Study of the iPod and Notebook PCs. INDUSTRY STUDIES ASSOCATION WORKING PAPER SERIES 2008-15
Barry Naughton. 2015. How China re-entered the Global and East Asia Economy. UC San Diego
Galina Hale, Bart Hobijn. 2011. The U.S. Content of “Made in China”. FRBSF ECONOMIC LETTER 2011-25.
US-CHINA Business Council. 2016. State Export Report
John Frisbie. 2017. Understanding the U.S.-China Trade Relationship. The US-China Business Council.
Apple Inc. 2016. Annual Report Form 10-K. United States Securities and Exchange Commission
2017. U.S. International Trade in Goods and Services. Bureau of Economic Analysis
Peter Draper, Uri Dadush, Gary Hufbauer, James Bacchus, and Robert Lawrence. 2012. The Shifting Geography of Global Value Chains: Implications for Developing Countries and Trade Policy. Global Agenda Council on the Global Trade System. World Economic Forum
Department of Commerce. 2017. “Initial Results of the 100-Day Action Plan of the U.S. – China Comprehensive Economic Dialogue”. Press Release 11 May. Available:
https://www.commerce.gov/news/press-releases/2017/05/joint-release-initial-results-100-day-action-plan-us-china-comprehensive
Ministry of Commerce of the PRC. 2017. Research Report on China-US Economic and Trade Relations. Press Release May 25. Available:
http://english.mofcom.gov.cn/article/newsrelease/significantnews/201705/20170502582932.shtml
Shen Jianguang. 2017. Calculating the damages of a Sino-US trade war. Global Times 17 January. Available:
http://www.globaltimes.cn/content/1029276.shtml
Yuan Gao. 2017. “Apple-Supplier Dialog Will Develop Chips With China’s Tsinghua”. Bloomberg 8 March. Available:
https://www.bloomberg.com/news/articles/2017-03-09/apple-supplier-dialog-will-develop-chips-with-china-s-tsinghua
Stephanie Thomson. 2017. “Jack Ma: America has wasted its wealth”. World Economic Forum Annual Meeting 18 January. Available:
https://www.weforum.org/agenda/2017/01/jack-ma-america-has-wasted-its-wealth/
Keyu Jin. 2017. “America’s coming trade war is based on a misunderstanding of both China and economics”. World Economic Forum 31 Mar. Available:
https://www.weforum.org/agenda/2017/03/trade-war-usa-china-trump/
Xiao Geng, Andrew Sheng. 2017. “This is why a positive relationship between China and the US matters for the average worker”. World Economic Forum 28 April. Available:
https://www.weforum.org/agenda/2017/04/this-is-why-a-positive-relationship-between-china-and-the-us-matters-for-the-average-worker
Source: IHS
Source: World Economic Forum Report
Source: Bureau of Economic Analysis, 2017